Environment
Energy consumption

Total energy consumption
VSME B3
Can your company specify its annual total energy consumption in MWh?
This question checks whether detailed information on energy consumption is available. If “Yes” is selected, further questions will appear.
|
Note You can obtain information on your energy consumption from electricity or heating bills. |
What is your company’s total energy consumption (in MWh per year) in the reporting year?
This question aims to record the absolute amount of MWh consumed.
To answer, add the total consumption of fuels and combustibles as well as the total electricity consumption (each renewable and non‑renewable), and report the result uniformly in megawatt‑hours (MWh).
Example
An Austrian paper products manufacturer prepared its energy balance at the end of the financial year. The company adds the natural gas heating consumption (400 MWh) and the diesel consumption of the delivery vehicles (100 MWh). In addition, total electricity consumption for machinery and administration amounted to 250 MWh according to invoices and PV self‑consumption.
The company calculates: 400 MWh + 100 MWh + 250 MWh = 750 MWh. This value is reported as the “total energy consumption”.
What is your company’s total energy consumption (in MWh per year) from renewable energy sources in the reporting year?
This question clarifies the share of sustainable energy in your total energy demand to make visible the progress in decarbonisation and the expansion of green energy.
To answer, you must add all renewable energy sources consumed in the company, including:
- self‑generated and self‑consumed electricity (e.g., photovoltaics),
- purchased renewable fuels (e.g., pellets, biogas),
- and the certified green‑electricity share of your electricity supply, expressed in megawatt‑hours (MWh).
|
Note The required information can be found on your electricity or heating invoices. Conversion factors for certain energy carriers can be found here. (German). |
Example
An Austrian wood‑processing company uses different green energy sources in its production. In the reporting year, the company directly consumed 150 MWh from its own photovoltaic system. Additionally, wood residues from production were used to fuel the chip heating system for drying chambers, equivalent to 200 MWh. The remaining electricity purchased consisted of 100% certified hydropower (50 MWh according to the electricity label).
The company adds the values 150 + 200 + 50 and reports a “total energy consumption from renewable energy sources” of 400 MWh.
What is your company’s total energy consumption (in MWh per year) from non‑renewable energy sources in the reporting year?
This question clarifies how dependent your company is on fossil and nuclear resources.
To answer, you must add the MWh values from your calculations for fossil fuels (e.g., natural gas, diesel, heating oil) and the non‑renewable share of your electricity mix.
Example
An Austrian plastics manufacturing plant identified two main items for the reporting year. First, machinery and heating consumed 800 MWh of natural gas. Second, electricity consumption totalled 400 MWh with a non‑renewable share (according to the electricity label) of 25%, resulting in 100 MWh.
The company adds these two values: 800 MWh + 100 MWh and reports a “total energy consumption from non‑renewable sources” of 900 MWh.
Dependence on fossil fuels
Is your business model dependent on fossil fuels in terms of your energy consumption?
This question clarifies the extent to which your business model relies on the use of fossil energy sources and how vulnerable it is to price increases (e.g., due to CO₂ taxes) or regulatory restrictions.
To answer, you must check whether essential parts of your operations fall under the criteria listed in the table.
|
Note Dependence on fossil fuels exists when the economic performance, business model, or assets of a company depend substantially on the use, extraction, or processing of fossil energy sources (coal, oil, natural gas). |
|
Dependency area |
Criteria |
|
Revenue and business‑model dependency: |
|
|
Cost and input dependency: |
Even without fossil core activities, dependency exists when:
|
|
Asset dependency: |
Dependency is present when:
|
|
Investment dependency: |
A company is considered dependent when:
|
Example
An Austrian bakery company operates its large ovens and branch heating systems exclusively with natural gas. Furthermore, its delivery fleet consists of diesel trucks. Since the company is entirely dependent on these fossil fuels for its core business operations (baking and delivery) and cannot switch to alternative energy sources in the short term:
The company answers the question with “Yes”.
Use the free‑text field to explain your company’s dependencies on fossil fuels.
This question clarifies how strongly your company still relies on climate‑damaging energy sources and what potential exists for switching to cleaner alternatives. To answer, refer to the criteria from the previous question.
Example
- Example A
A medium‑sized Austrian brickworks operates its kilns exclusively with natural gas, as the high temperatures required for firing cannot currently be achieved economically with electricity. In the free‑text field, the company explains that there is a cost and input dependency, since energy costs account for around 30% of total expenses and are directly linked to the price of natural gas. The company also indicates an asset dependency, as the long‑lived kilns (remaining lifetime of 15 years) are fully designed for gas operation, and early replacement — due to the lack of infrastructure for green hydrogen — would lead to significant asset impairment.
- Example B
An Austrian fuel trader currently generates 70% of its revenue from selling heating oil and diesel to private and commercial customers. In the free‑text field, the company discloses a strong revenue dependency. However, as the company plans to convert its truck fleet to electric vehicles within the next three years and expand its product range to include wood pellets, it describes its investment dependency: Current CapEx investments are already being directed toward expanding renewable product lines to gradually reduce fossil‑related revenues in line with EU climate targets and minimize the risk of stranded assets.
Electricity Consumption
VSME B3
Can your company specify its annual electricity consumption in MWh?
This question checks whether detailed information about electricity consumption is available. If “Yes” is selected, additional questions will appear.
To answer, you must ensure that you systematically record both your electricity bills and any data on self‑generated and self‑consumed electricity (e.g. from a photovoltaic system), and that you can convert these values if required.
|
Note Conversion factors for certain energy sources can be found here. (German) |
What is your company’s total electricity consumption in the reporting year? (in MWh per year)
This question aims to clarify how many MWh of electricity your company required in total during the reporting year.
To answer, you must provide the sum of all electricity consumed in your operations, regardless of whether the electricity was purchased or self‑generated.
Example
An Austrian software company evaluated its electricity consumption for the year 2025. The annual energy bill shows a grid consumption of 45,000 kWh for the office space. In addition, the company operates a rooftop photovoltaic system, from which 15,000 kWh were consumed directly in the building for server cooling (self‑consumption).
The company adds the grid electricity and the self‑consumed electricity: 45,000 + 15,000 = 60,000 kWh, and divides the result by 1,000 to obtain the value in megawatt‑hours. In the report, the SME states a “total electricity consumption” of 60 MWh.
What is your company’s total electricity consumption from renewable energy sources in the reporting year? (in MWh per year)
This question aims to quantify the share of green electricity used by your company and to assess the extent to which climate‑friendly energy sources are already being utilised.
To answer, you need your electricity bills (supplier’s energy mix information) and data from your own generation systems (e.g. photovoltaic), in order to provide the total amount of renewable electricity consumed in megawatt‑hours (MWh).
|
Note Conversion factors for certain energy sources can be found here.(German) |
The share of renewable electricity consumption can be calculated based on guarantees of origin, renewable energy certificates or the electricity mix indicated on the electricity bill. The bill may show the proportion of electricity from renewable sources which you apply to your total consumption in MWh.
The company must not offset its electricity consumption against its energy generation, even if electricity generated at one site is sold to third parties. When reporting consumption of self‑generated electricity, double‑counting of fuel consumption must be avoided. If the company generates electricity from a non‑renewable or renewable fuel source and subsequently consumes it, the energy consumption is counted only once — at the fuel consumption stage.
Example
An Austrian carpentry business consumed a total of 120 MWh of electricity in the reporting year. The company purchases a certified green electricity tariff, which according to the supplier’s energy mix consists of 100% hydropower and wind power. Additionally, the rooftop photovoltaic system produced 30 MWh that were consumed directly on site.
The company adds both values: 120 MWh + 30 MWh and reports a “total electricity consumption from renewable energy sources” of 150 MWh.
What is your company’s total electricity consumption from NON‑renewable energy sources in the reporting year? (in MWh per year)
This question aims to clarify how much electricity your company sourced from fossil or nuclear energy, in order to assess the associated indirect environmental impacts.
To answer, you need your electricity bills and the energy mix indicated there. The relevant figure is the percentage of non‑renewable sources, which you apply to your total electricity consumption in megawatt‑hours (MWh).
|
Note Conversion factors for certain energy sources can be found here. (German) |
Example
An Austrian industrial company consumed 500 MWh of electricity in the reporting year. According to the electricity mix on the annual bill, 20% of the supplied electricity came from natural gas (non‑renewable), because the company had not booked a green electricity tariff. Thus, the company calculates: 500 MWh × 0.20 = 100 MWh.
In the report, the SME therefore states 100 MWh as the “total electricity consumption from non‑renewable energy sources”.
Reduction measures - Electricity
What measures is your company taking to reduce electricity consumption?
This question is optional. It allows you to present existing and planned measures to reduce electricity consumption and to better understand your energy use.
To answer, you should mention technical upgrades, organisational changes, or investments in more efficient equipment that sustainably reduce electricity demand.
Example
An Austrian bakery business found that its old cooling and baking ovens had very high electricity consumption.
- To counteract this high usage, the company converted all lighting in the bakery area and the salesroom to LED with motion sensors.
- In addition, it installed a load management system that optimises the switching times of the ovens to avoid costly load peaks.
Through these measures, the company was able to reduce its annual electricity consumption by 15%.
Total Consumption of Fuel
VSME B3
Can your company specify its annual total consumption of fuel in MWh?
This question checks whether detailed information on the company’s annual total consumption of fuels and combustibles is available. If “Yes” is selected, additional questions will appear.
To answer the following questions, you will need data on the quantities of fuels and combustibles consumed (usually documented through invoices).
|
Note When preparing information on energy consumption, the company excludes input materials and fuels that are not burned for energy purposes. A company that consumes fuels as input materials may provide information on this consumption separately from mandatory disclosures. Conversion factors for specific energy sources can be found here. |
What is your company's total consumption of fuel (in MWh per year) for the reporting year?
This question aims to clarify the total amount of energy your company consumed through the combustion of fuels and combustibles (both fossil and renewable) during the reporting year.
To answer, you must add the consumption of all solid, liquid, and gaseous energy sources used directly in your equipment or vehicles and express the sum uniformly in megawatt‑hours (MWh).
|
Note Conversion factors for certain energy sources can be found here. (German) If a company generates electricity from renewable or non‑renewable fuels and consumes this electricity itself, the energy consumption is recorded only once — under “total fuel and combustible consumption”. Self‑generated and consumed electricity is not counted again as electricity consumption (see also here). |
Example
An Austrian timber construction company prepared its full energy balance for fuels in the reporting year. The company consumed 50,000 kWh of natural gas (non‑renewable) to heat the workshop and 20 MWh of wood pellets (renewable) for its spray booth. Additionally, 5,000 litres of diesel were used for company vehicles, equivalent to 50 MWh.
The company adds these values — 50 MWh natural gas + 20 MWh pellets + 50 MWh diesel — and reports a “total fuel and combustible consumption” of 120 MWh.
What is your company’s total fuel and combustible consumption from renewable energy sources in the reporting year?
This question aims to determine the share of renewable energy sources used in your company.
To answer, you must add the quantities of all energy sources from renewable origins that are used directly in your company for heat or power generation (e.g. pellets, biodiesel, biogas) and express them in megawatt‑hours (MWh).
|
Note Conversion factors for certain energy sources can be found here. (German) If a company generates electricity from renewable or non‑renewable fuels and consumes this electricity itself, the energy consumption is recorded only once — under “total fuel and combustible consumption”. Self‑generated and consumed electricity is not counted again as electricity consumption (see also here). |
Example
An Austrian hotel business has partially converted its energy supply to renewable sources. For heating, it purchased 15 tonnes of wood pellets in the reporting year. Since one tonne of pellets corresponds to approximately 4.8 MWh, this results in 72 MWh of fuel consumption (15 × 4.8 MWh/t). Additionally, the hotel’s shuttle bus runs exclusively on pure vegetable oil (HVO). According to fuel receipts, 2,000 litres were consumed (equivalent to approx. 17.27 MWh).
The company adds both values and reports a “total consumption from renewable sources” of 89.27 MWh.
What is your company’s total fuel and combustible consumption from NON‑renewable energy sources in the reporting year?
This question clarifies how dependent your company is on fossil fuels, which cause greenhouse gas emissions and rely on finite resources.
To answer, you must convert and sum the consumption of energy sources such as heating oil, natural gas, diesel or petrol into megawatt‑hours (MWh), based on your invoices. Only the quantities directly burned in your company count.
|
Note Conversion factors for certain energy sources can be found here. (German) If a company generates electricity from renewable or non‑renewable fuels and consumes this electricity itself, the energy consumption is recorded only once — under “total fuel and combustible consumption”. Self‑generated and consumed electricity is not counted again as electricity consumption (see also here). |
Example
An Austrian plumbing company evaluates its invoices for the reporting year for its vehicle fleet (diesel) and building heating (natural gas). The fleet consumed 15,000 litres of diesel, and the heating consumed 80,000 kWh of natural gas. To correctly report the total consumption from non‑renewable sources, the company converted the units into megawatt‑hours using conversion factors and summed them to a total of 226.76 MWh.
15,000 l × 0.84 kg/l = 12,600 kg
12,600 kg × 11.65 kWh/kg = 146,790 kWh
146,790 kWh / 1,000 = 146.79 MWh
80,000 kWh / 1,000 = 80 MWh
Σ = 146.79 MWh + 80 MWh = 226.76 MWh
Greenhouse gas emissions
VSME B3/C2
Does your company calculate its greenhouse gas emissions according to the GHG Protocol?
This question serves to determine whether you use the internationally recognised GHG Protocol standard to methodically and comparably record your carbon footprint. To answer it, please indicate whether your company carries out its calculations in accordance with the requirements of the Greenhouse Gas Protocol, which divides emissions into the categories Scope 1, 2 and 3.
Please provide the greenhouse gas emissions determined by your company for (1) the reporting year, (2) the base year, (3) the short-term target year and (4) the long-term target year 2050.
This question serves to determine the size of your company's greenhouse gas footprint. The value provided therefore represents the calculated total impact of your company on the climate.
Greenhouse gas emissions are determined and presented separately for Scope 1, 2 and 3 in accordance with the requirements of the GHG Protocol. To ensure that the values are comparable, the impacts of the various greenhouse gases are converted into CO₂ equivalents (CO₂e).
|
Term |
Meaning |
Examples |
|
Direct greenhouse gas emissions (Scope 1) |
Direct greenhouse gas emissions from sources that are owned or controlled by the company. |
Stationary installations (e.g. heating systems) Mobile installations (e.g. vehicles) |
|
Indirect greenhouse gas emissions (Scope 2) |
Indirect greenhouse gas emissions are emissions that arise as a result of the company's activities but at sources owned or controlled by another company. Scope 2 greenhouse gas emissions are indirect emissions from the generation of purchased or acquired electricity, heat, steam or cooling consumed by the company. |
Emissions from the generation of purchased electricity, steam or district heating and cooling |
|
Location-based |
Scope 2 emissions can be calculated in two ways: location-based or market-based. Location-based means: Emissions calculated on the basis of the average emission intensity of the electricity grid of the country in which the electricity is consumed. |
|
|
Market-based |
Scope 2 emissions can be calculated in two ways: location-based or market-based. Market-based means: Emissions calculated using the emission factors specified in electricity contracts or by the energy supplier. |
|
|
Indirect greenhouse gas emissions (Scope 3) |
Are all indirect greenhouse gas emissions that arise along the entire value chain of a company but cannot be directly attributed to the company (e.g. from suppliers, customers, waste disposal, business travel). Following the GHG Protocol, they are divided into 15 categories (upstream & downstream) and often account for the largest share of the carbon footprint, making their capture critical for companies to achieve climate targets and meet regulatory requirements. |
Purchased goods and services, capital goods, fuel- and energy-related emissions (not included in Scope 1 or 2), upstream transportation and distribution, … |
|
Note for companies without determined values If you need help determining your greenhouse gas emissions, you can use the free Tools here. |
Instructions for correctly completing the table
Step 1: Create a new year
- To enter the values, create a new reporting year by clicking the blue button "+ New year".
- Select whether you want to create a base year, a reporting year or a target year and enter the corresponding year.
- Reporting year: Multiple reporting years can be created, although these must not be in the future and must not coincide with the base year.
- Base year: The base year must not be in the future. Note: When you create a base year, the long-term target year 2050 is automatically created.
- Target year: Multiple target years can be created. These must not be in the past and must not already be used for another reporting/base year. In addition to the automatically created target year 2050, a second "short-term" target year can be created whose year can be adjusted manually.
- After confirming by clicking the "Create new year" button, a spreadsheet for the created year opens automatically. Select here in which form you would like to enter your data (see below).
|
Term |
Meaning |
|
Reporting year |
Is generally the year to which all information in the questionnaire refers. |
|
Base year |
Generally represents the first year for which you have collected comprehensive data and knowledge about your company's greenhouse gas emissions. |
|
Target year |
Represents the year by which your company aims to achieve a defined climate target. |
|
Note Please note that changing the table view will delete all data already entered in the relevant spreadsheet. |
Step 2: Data entry
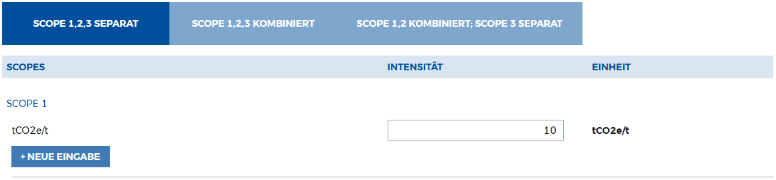
Currently, you have the option to enter the data in the following format:
- Scope 1, 2, 3 separate: Under this table tab you can enter the three scope values separately from one another. It is possible to enter both detailed individual values and total values.
- Aggregated data: Here only total values of the individual scope values (Scope 1, Scope 2 LB/MB, Scope 3) can be entered.
- Detailed data: Here you have the option to enter underlying information for the respective scopes. Additional categories within the individual scopes can be added via the "New entry" button. These detailed pieces of information are automatically summed up to a total scope value per scope.
|
Note: Entering the target year The input fields for the target year differ from those in the base and reporting year. In the target year you do not enter absolute emission values, but instead define how much the emissions should change compared to the base year. Two important fields are available for this purpose:
|
Example
The base value in 2020 is 100 t CO₂e. For 2050, the company sets itself a reduction target of –90%. Due to a new installation from 2025, emissions increase by 30%. The base value is therefore adjusted by entering the value 130% in the "Target share of base value" field.
Entry in target year 2050:
- Target share of base value: 130%
- Reduction target relative to base year in %: –90%
Complete conversion example
An Austrian production company wishes to calculate its emissions for the reporting year 2025. The company uses heating oil to heat the workshop.
Determining consumption:
|
Quantity |
|
|
Quantity purchased in 2025 |
5,000 litres |
|
Stock on 01.01.2025 |
800 litres |
|
Stock on 01.01.2026 |
300 litres |
5,000 + (800 - 300) = 5,500 litres actual consumption
Calculating emissions (in kg):
Emission factor used (according to the Federal Environment Agency - Austria):
3.45 kg/l
5,500 l × 3.45 kg/l = 18,975 kg CO2e
Conversion into tonnes (CO2e):
18,975 kg / 1,000 = 18.98 t CO2e (rounded).
Entering into the table:
|
Base year 2020 |
Reporting year 2025 |
Short-term target year 2030 |
Long-term target year 2050 |
|
25.50 t CO2e |
18.98 t CO2e |
12.00 t CO2e |
0 t CO2e |
Are your calculated GHG emissions (Scope 1, 2, and 3) verified by an independent auditing organization?
This question is intended to clarify whether your greenhouse gas balance has not only been prepared according to the world's leading standard (GHG Protocol), but has also been verified by an external body for its accuracy and completeness. To answer it, you must indicate whether the calculations for direct (Scope 1), indirect (Scope 2) and upstream/downstream emissions (Scope 3) have been verified by an independent auditor or a specialised certification body.
Greenhouse gas emissions
VSME B3/C2
Does your company calculate its greenhouse gas emissions according to the GHG Protocol?
This question serves to determine whether you use the internationally recognised GHG Protocol standard to methodically and comparably record your carbon footprint. To answer it, please indicate whether your company carries out its calculations in accordance with the requirements of the Greenhouse Gas Protocol, which divides emissions into the categories Scope 1, 2 and 3.
Please provide the greenhouse gas emissions determined by your company for (1) the reporting year, (2) the base year, (3) the short-term target year and (4) the long-term target year 2050.
This question serves to determine the size of your company's greenhouse gas footprint. The value provided therefore represents the calculated total impact of your company on the climate.
Greenhouse gas emissions are determined and presented separately for Scope 1, 2 and 3 in accordance with the requirements of the GHG Protocol. To ensure that the values are comparable, the impacts of the various greenhouse gases are converted into CO₂ equivalents (CO₂e).
|
Term |
Meaning |
Examples |
|
Direct greenhouse gas emissions (Scope 1) |
Direct greenhouse gas emissions from sources that are owned or controlled by the company. |
Stationary installations (e.g. heating systems) Mobile installations (e.g. vehicles) |
|
Indirect greenhouse gas emissions (Scope 2) |
Indirect greenhouse gas emissions are emissions that arise as a result of the company's activities but at sources owned or controlled by another company. Scope 2 greenhouse gas emissions are indirect emissions from the generation of purchased or acquired electricity, heat, steam or cooling consumed by the company. |
Emissions from the generation of purchased electricity, steam or district heating and cooling |
|
Location-based |
Scope 2 emissions can be calculated in two ways: location-based or market-based. Location-based means: Emissions calculated on the basis of the average emission intensity of the electricity grid of the country in which the electricity is consumed. |
|
|
Market-based |
Scope 2 emissions can be calculated in two ways: location-based or market-based. Market-based means: Emissions calculated using the emission factors specified in electricity contracts or by the energy supplier. |
|
|
Indirect greenhouse gas emissions (Scope 3) |
Are all indirect greenhouse gas emissions that arise along the entire value chain of a company but cannot be directly attributed to the company (e.g. from suppliers, customers, waste disposal, business travel). Following the GHG Protocol, they are divided into 15 categories (upstream & downstream) and often account for the largest share of the carbon footprint, making their capture critical for companies to achieve climate targets and meet regulatory requirements. |
Purchased goods and services, capital goods, fuel- and energy-related emissions (not included in Scope 1 or 2), upstream transportation and distribution, … |
|
Note for companies without determined values If you need help determining your greenhouse gas emissions, you can use the free Tools here. |
Instructions for correctly completing the table
Step 1: Create a new year
- To enter the values, create a new reporting year by clicking the blue button "+ New year".
- Select whether you want to create a base year, a reporting year or a target year and enter the corresponding year.
- Reporting year: Multiple reporting years can be created, although these must not be in the future and must not coincide with the base year.
- Base year: The base year must not be in the future. Note: When you create a base year, the long-term target year 2050 is automatically created.
- Target year: Multiple target years can be created. These must not be in the past and must not already be used for another reporting/base year. In addition to the automatically created target year 2050, a second "short-term" target year can be created whose year can be adjusted manually.
- After confirming by clicking the "Create new year" button, a spreadsheet for the created year opens automatically. Select here in which form you would like to enter your data (see below).
|
Term |
Meaning |
|
Reporting year |
Is generally the year to which all information in the questionnaire refers. |
|
Base year |
Generally represents the first year for which you have collected comprehensive data and knowledge about your company's greenhouse gas emissions. |
|
Target year |
Represents the year by which your company aims to achieve a defined climate target. |
|
Note Please note that changing the table view will delete all data already entered in the relevant spreadsheet. |
Step 2: Data entry
Currently, you have the option to enter the data in the following format:
- Scope 1, 2, 3 separate: Under this table tab you can enter the three scope values separately from one another. It is possible to enter both detailed individual values and total values.
- Aggregated data: Here only total values of the individual scope values (Scope 1, Scope 2 LB/MB, Scope 3) can be entered.
- Detailed data: Here you have the option to enter underlying information for the respective scopes. Additional categories within the individual scopes can be added via the "New entry" button. These detailed pieces of information are automatically summed up to a total scope value per scope.
|
Note: Entering the target year The input fields for the target year differ from those in the base and reporting year. In the target year you do not enter absolute emission values, but instead define how much the emissions should change compared to the base year. Two important fields are available for this purpose:
|
Example
The base value in 2020 is 100 t CO₂e. For 2050, the company sets itself a reduction target of –90%. Due to a new installation from 2025, emissions increase by 30%. The base value is therefore adjusted by entering the value 130% in the "Target share of base value" field.
Entry in target year 2050:
- Target share of base value: 130%
- Reduction target relative to base year in %: –90%
Complete conversion example
An Austrian production company wishes to calculate its emissions for the reporting year 2025. The company uses heating oil to heat the workshop.
Determining consumption:
|
Quantity |
|
|
Quantity purchased in 2025 |
5,000 litres |
|
Stock on 01.01.2025 |
800 litres |
|
Stock on 01.01.2026 |
300 litres |
5,000 + (800 - 300) = 5,500 litres actual consumption
Calculating emissions (in kg):
Emission factor used (according to the Federal Environment Agency - Austria):
3.45 kg/l
5,500 l × 3.45 kg/l = 18,975 kg CO2e
Conversion into tonnes (CO2e):
18,975 kg / 1,000 = 18.98 t CO2e (rounded).
Entering into the table:
|
Base year 2020 |
Reporting year 2025 |
Short-term target year 2030 |
Long-term target year 2050 |
|
25.50 t CO2e |
18.98 t CO2e |
12.00 t CO2e |
0 t CO2e |
Are your calculated GHG emissions (Scope 1, 2, and 3) verified by an independent auditing organization?
This question is intended to clarify whether your greenhouse gas balance has not only been prepared according to the world's leading standard (GHG Protocol), but has also been verified by an external body for its accuracy and completeness. To answer it, you must indicate whether the calculations for direct (Scope 1), indirect (Scope 2) and upstream/downstream emissions (Scope 3) have been verified by an independent auditor or a specialised certification body.
GHG-Intensity
VSME B3
Indicate your greenhouse gas intensity.
This question aims to put your greenhouse gas emissions in relation to your economic performance, allowing the carbon efficiency of your company to be compared independently of its size.
To answer, divide your total greenhouse gas emissions (Scope 1, location-based Scope 2 and Scope 3 emissions in tonnes of CO2-equivalent) by your revenues.
|
Term |
Meaning |
|
Gross greenhouse gas (GHG) emissions |
Gross greenhouse gas emissions refer to the total GHG emissions that the company releases into the atmosphere, without subtracting CO2 removals or applying any other adjustments. |
|
Scope 1 |
Direct greenhouse gas emissions from sources owned or controlled by the company. |
|
Location-based Scope 2 emissions |
Emissions from electricity, heat, steam or cooling purchased or acquired and consumed by the reporting company, calculated using the location-based “allocation method”, which allocates producer emissions to end users. These reflect the average emission intensity of the grid where the energy is consumed and are generally based on average grid emission factors. Typical sources of Scope 2 emissions include any facilities consuming electricity (electric motors, lighting, buildings), heat (industrial processes, heating), steam (industrial processes) or cooling (industrial processes, buildings). |
Instructions for completing the table correctly
Step 1: Create a new year
- To enter values, create a new reporting year by clicking the blue button “+ New year”.
- Select whether you want to create a baseline year, a reporting year or a target year, and enter the corresponding year.
- Reporting year: Multiple reporting years may be created, but they must not lie in the future and must not coincide with the baseline year.
- Baseline year: The baseline year must not lie in the future. Additional note: If you create a baseline year, the long-term target year 2050 is automatically created.
- Target year: Multiple target years may be created. These must not lie in the past and must not already be linked to another reporting or baseline year. In addition to the automatically created target year 2050, a second “short-term” target year may be created, which can be entered manually.
- After confirming by clicking “Create new year”, a table sheet opens automatically for the newly created year. Choose in which format you would like to enter your data (see below).
|
Term |
Meaning |
|
Reporting year |
This is generally the year to which all information in the questionnaire refers. |
|
Baseline year |
This is generally the first year for which your company has gathered comprehensive data and insights on its greenhouse gas emissions. |
|
Target year |
This is the year by which your company aims to achieve a defined climate target. |
|
Note Please note that if the table view is changed, all data already entered in that sheet will be deleted. |
Step 2: Data entry
Depending on the availability of your data, you can choose how to enter your information. The following options are available:
- Scope 1, 2, 3 combined: In this table tab, you can calculate an intensity value from the sum of all three scopes divided by your company’s output.
- Scope 1, 2 combined; Scope 3 separate: In this tab, you can enter your Scope 1 & 2 values combined and indicate Scope 3 separately — one value for Scope 1+2 and one value for Scope 3.
- Scope 1, 2, 3 separate: In this tab, you can enter the three scope values separately. You can provide both detailed individual values and total values.
|
Note Please note that if the table view is changed, all data already entered in the respective sheet will be deleted. |
Example
|
Combined greenhouse gas emissions (Scope 1 and location‑based Scope 2) |
1,000 t CO2e |
|
Revenues |
5,000,000 € |
Greenhouse gas intensity = 1,000 t CO2e / 5,000,000 € = 0.0002 t CO2e per €

Actions greenhouse gas targets
VSME C3
Specify the list of main actions your company will implement to achieve its greenhouse gas emission targets.
This optional question allows you to present existing and planned measures to reduce greenhouse gas emissions and to better understand your company’s GHG balance.
To answer, you should name the most important operational changes, such as decarbonising the supply chain, investing in energy efficiency, or switching to renewable energy sources.
Example
An Austrian metal goods manufacturing company has set the goal of reducing its emissions by 40% by 2030. Key measures include the installation of a 1,500 m² photovoltaic system on the factory roof and the replacement of the old gas heating system with an industrial heat pump. Additionally, a new procurement policy was introduced that prioritises suppliers producing steel with a lower CO2 footprint.
High Climate Impact Sector
VSME C3
Do you operate in a high climate impact sector?
This question aims to determine whether your company belongs to an industry that typically emits high levels of greenhouse gases due to its processes and is therefore particularly affected by climate regulation.
To answer, you must check whether your main business activity falls within sectors such as energy generation, heavy industry (e.g. steel, cement), mining or aviation, as these often face stricter reporting and reduction requirements.
|
Note Sectors with high climate impact are listed in NACE Sections A to H and Section L according to Annex I of Regulation (EC) No 1893/2006. |
Does your company already have a transition plan for climate change mitigation?
If yes, describe it and explain how it contributes to reducing greenhouse gas emissions.
This question aims to clarify whether your company follows a long‑term strategy to systematically reduce CO₂ emissions and align its business model with climate neutrality.
To answer, describe your concrete targets (e.g. net zero by 2040), the planned measures such as switching to renewable energy, and how these actions contribute to achieving the Paris climate goals.
|
Term |
Meaning |
|
Transition plan |
A climate transition plan outlines a set of current and future measures intended to align the company’s business model, business strategy and operations with the overarching global objective of limiting global warming to 1.5 °C. Supported by a GHG‑reduction target consistent with that objective, the purpose of such a plan is to explain how the company will transition to a low‑carbon economy and to track progress along the way. The key elements of a transition plan include:
|
If your company does not yet have a transition plan for climate change mitigation: Is the introduction of such a plan planned?
If yes, by when? Please enter the date (DD / MM / YYYY) in the free‑text field.
This question aims to determine whether your company is developing a strategic roadmap to gradually adapt its business model to a low‑carbon economy and support the objectives of the Paris Climate Agreement.
To answer, state by when the plan is intended to be formalised in a structured document.
Air, water, and soil pollution

Pollution of air, water and soil
VSME B4
If your company is already required to report its emissions, or if you report them voluntarily, indicate the amount (in kg) of the respective pollutants that you emit into air, water and soil.
This question aims to clarify the extent to which your company releases harmful substances directly into the environment, in order to transparently demonstrate compliance with statutory limit values and environmental standards. It is aimed in particular at companies subject to reporting obligations as well as those that disclose such information voluntarily.
To answer, you must provide the annual emission loads (in kilograms) for specific pollutants.
|
Note A reporting obligation may arise from requirements of competent authorities, for example under national legislation or the Industrial Emissions Directive (IED). Further information on requirements for companies can also be found in VSME B4 from point 46. |
Example
An Austrian metalworking company operates a coating plant that is subject to E‑PRTR reporting requirements. For the reporting year, the company calculated that 450 kg of volatile organic compounds (VOC) were emitted into the air through the extraction systems of the paint booths. At the same time, after internal wastewater treatment, 12 kg of zinc residues were measured in the discharged wastewater. The company reports these values as “450 kg VOC (air)” and “12 kg zinc (water)”. Through this precise documentation, the SME demonstrates compliance with Austrian emissions regulations and establishes a reliable data basis for future reduction measures.
Air: 450 kg VOC
Water: 12 kg zinc
If this information is publicly available, you may reference the document by providing a link in the free‑text field.
This question follows up on your pollutant disclosures in air, water and soil.
If the corresponding data have been published, answer “Yes” and provide the relevant link in the free‑text field.
Biodiversity
Biodiversity-sensitive areas
VSME B5
Indicate the number and area (in hectares or m²) of sites that you own, lease, or manage in or near a biodiversity sensitive area.
This question serves to determine whether your sites bear a particular ecological responsibility because they are geographically close to valuable nature conservation areas.
To answer it, you must compare your property data with official nature conservation registers (such as Natura 2000, national parks or nature reserves) and provide the corresponding number of affected properties as well as their area in m² or hectares.
|
Note
|
Example
- Number of plots: 1
- Area: 0.8 hectares
- Location: The plot is located directly within an ecologically sensitive Habitats Directive (FFH) area.
Please provide the following key figures relating to your company's land use (in hectares or m²).
This question is intended to clarify how much physical space your company occupies and how these areas affect the environment, particularly with regard to soil sealing and the preservation of habitats.
To answer it, you will need your property or rental contracts, site plans and current surveys of your operational premises in order to divide the areas into sealed (built-up/asphalted) and near-natural (unsealed/green) zones.
|
Term |
Meaning |
|
Sealed areas |
are areas where the natural soil has been covered – for example by buildings, roads or car parks – preventing water from entering the ground. |
|
Green or nature-oriented areas |
are areas that serve to preserve or promote nature. They may be located on the company premises, e.g. green roofs, façades or constructed biotopes, or also outside, provided they are owned or maintained by the company and primarily benefit biodiversity. |
|
Note To identify protected and biodiversity-sensitive areas, international databases such as the World Database on Protected Areas (WDPA), the Key Biodiversity Areas or the IUCN Red List can be consulted. Tools such as the IBAT Tool can also be used for support. "Near" refers to an area that (partially) overlaps with or is adjacent to an area in need of biodiversity protection. |
Impact on biodiversity
How do your company's activities affect biodiversity?
This question is optional. It serves to analyze the positive and negative impacts of your company on natural diversity, ecosystems, and habitats.
To answer, you must assess whether your sites, supply chains, or products contribute to land use change, pollution, or the spread of invasive species, for example.
Example
A medium-sized Austrian food producer investigated how the construction of a new warehouse would affect the local environment. As a meadow had to be sealed off to make way for the warehouse, the company identified a negative impact on local biodiversity. As a countermeasure and to promote positive effects, the company planted a flowering meadow with native wild plants on the remaining company premises and greened the roof of the warehouse. This analysis, which complies with Austrian nature conservation law, enables the company to transparently disclose in its report the impacts it causes and how it actively contributes to the restoration of habitats.
Water
Water consumption
VSME B6
Indicate the total volume of water withdrawn across all sites.
This question aims to capture the total water demand of your company across all operational locations, in order to illustrate the cumulative dependency on this resource.
To answer, you must add together the water withdrawal volumes (from the public supply network, groundwater or surface water) across all your sites – whether production, storage or administration – and report the total in cubic metres (m³). Round the result to two decimal places.
|
Term |
Meaning |
Examples |
|
Water withdrawal |
Water withdrawal refers to the amount of water brought into the organisational boundaries of the company from any source during the reporting period. |
|
Instructions for completing the table correctly
Step 1: Create a new year
- To enter values, create a new reporting year by clicking the blue button “+ New year”.
- Select whether you want to create a baseline year, a reporting year or a target year and enter the corresponding year.
- Reporting year: Several reporting years may be created, but they must not lie in the future and must not coincide with the baseline year.
- Baseline year: The baseline year must not lie in the future. Note: If you create a baseline year, the long-term target year 2050 is automatically created.
- Target year: Several target years may be created. They must not lie in the past and must not already be linked to another reporting or baseline year. In addition to the automatically generated 2050 target year, a second “short-term” target year can be created, which can be entered manually.
- After confirming by clicking “Create new year”, a table sheet will automatically open for the newly created year. Here, select the format in which you want to enter your data (see below).
|
Term |
Meaning |
|
Reporting year |
Is generally the year to which all information in the questionnaire refers. |
|
Baseline year |
Is generally the first year for which you have collected comprehensive data and insights about your company’s greenhouse gas emissions. |
|
Target year |
The year by which your company aims to achieve a defined climate target. |
|
Note Please note that if you change the table view, all data already entered in the respective sheet will be deleted. |
Step 2: Data entry
Based on the availability of your data, you can choose how to enter your information. The following options are available:
- Summarised view: You enter the total water consumption as a single total value.
- Detailed view: This view allows you to break down water consumption, increasing the transparency of your information.
|
Note Please ensure that the correct unit of measurement is used when entering data! Conversion from L to m³ Volume in m³ = Volume in L / 1000 Please note that you must select both the unit and the table view before you begin entering data, as any change afterwards will delete the data already entered. |
Amount of water withdrawn at sites located in areas with high water stress
This question aims to clarify the extent to which your company sources water from regions where water scarcity exists and where consumption therefore has particularly critical impacts on the environment and the local community.
To answer, you must check whether your sites are located in geographic zones classified as “water‑stress areas” and report the amount of water withdrawn there (in m³). Round the result to two decimal places.
|
Note To assess water stress levels, you may use local water authorities or freely available tools such as the Aqueduct Water Risk Atlas (WRI). A baseline water stress value above 40% indicates a high water‑stress area. |
Water discharge from your company’s production processes
This question aims to clarify the quantities of wastewater generated by your company’s operations and how they are returned to the environment or the sewage system.
To answer, you need data on the total wastewater volume (in m³) discharged into the sewage system (indirect discharge) or directly into a water body (direct discharge). This is usually documented via wastewater meters or the billing records of the water utility. Round the result to two decimal places.
|
Term |
Meaning |
|
Water discharge |
“Water discharge” refers to the amount of water released directly into water bodies such as lakes or rivers, into the public sewage system, or transferred to other companies for cascading water use. It can be considered the water output of the company. |
|
Note Conversion from L to m³ Volume in m³ = Volume in L / 1000 |
Indicate the total water consumption.
This question aims to clarify the amount of water your company withdraws from various sources, minus the amount returned, in order to assess the impact of your operations on local water resources.
To answer, you must sum all water volumes consumed during the reporting period in cubic metres (m³). These values can typically be obtained from water utility invoices or from your own meter readings (e.g. for well water). Round the result to two decimal places.
|
Term |
Meaning |
|
Water consumption |
Water consumption is the amount of water brought into the system boundaries of the company that is not returned to the water environment or to a third party. This typically includes evaporated or vaporised water (e.g., in thermal energy processes such as drying or power generation), water incorporated into products (e.g. in food production), or water used for irrigation (e.g. in agriculture or landscaping at the company site). |
Calculation
Water consumption = (Water withdrawal) – (Water discharged).
Use the value you entered under Water Withdrawal at the top of this question and subtract from it the amount of discharged water (value from the previous question).
Reduction measures - Water
What measures does your company take to reduce water consumption?
This question is optional. It serves to illustrate how responsibly your company uses the valuable resource of water and what steps you are taking to reduce consumption and the associated costs.
In your answer, you should mention specific technical or organizational changes, such as the installation of water-saving fittings, the use of rainwater, or the optimization of cleaning processes.
Example
An Austrian textile cleaning company analyzed its water consumption and found that large amounts of drinking water were being used for pre-washing. As a measure, the company installed a water recycling system that filters the lightly soiled rinse water and reuses it for the next wash cycle. In addition, all hand washbasins in the staff rooms were equipped with infrared sensors to stop unnecessary running. These measures enabled the SME to reduce its fresh water consumption by 30%.
Waste and recycling

Circular economy
VSME B7
Indicate whether your company applies the principles of the circular economy. If yes, describe the key principles of your circular strategy.
This question aims to clarify whether your company already implements strategies to keep products and materials in the economic cycle for as long as possible and to avoid waste.
|
Note The most important principles of a circular economy are defined by the Ellen MacArthur Foundation.
|
Example
An Austrian manufacturer of office furniture actively applies the principles of the circular economy. The strategy is based on the principle of “Design for Disassembly”: furniture is designed so that individual parts (such as cushions or wheels) can be easily replaced or repaired instead of disposing of the entire item. In addition, the company offers a take‑back service for old furniture in order to return reusable wood and metal components as secondary raw materials into its own production cycle.
Waste generation
VSME B7
Indicate whether your company can provide the total waste generated for the reporting year.
This question aims to clarify whether your company has a functioning waste‑management system and is able to fully document all waste streams.
To answer, you must confirm whether you have recorded all waste quantities (in tonnes) for the reporting period.
Indicate the total quantity of waste generated in your company during the reporting year.
This question aims to determine the total amount of waste generated in your company in order to assess the overall environmental impact from residual materials.
To answer, you must calculate the sum of all waste types (hazardous and non‑hazardous) generated in your operations during the year — regardless of whether they were later recycled, incinerated, or landfilled.
|
Instructions for completing the table
You can use an Excel calculator (German only) as guidance. |
Please note that you must select both the unit and the view before you begin filling in the table, as changing either afterwards will delete the data already entered.
|
Term |
Meaning |
|
Reporting year |
Multiple reporting years may be created; they must not lie in the future and must not coincide with baseline years. |
|
Baseline year |
The baseline year reflects the starting situation and is used as the reference point for achieving target values. |
|
Target year |
Target years must not lie in the past and must not already be used for another reporting/baseline year. Target values relate to… |
|
Hazardous waste |
Waste that exhibits one or more of the hazardous properties listed in Annex III of Directive 2008/98/EC of the European Parliament and Council on waste. Examples include: |
Total data: Only totals for the individual waste types can be entered here. These are then automatically added up.
Detailed data: Here you have the option of entering underlying information on the respective
waste quantities. This detailed information is automatically added up to a total value for each waste type.
Additional categories can be added to the individual waste types using the “New entry” button.
Waste recycling
VSME B7
Indicate the annual total amount of waste intended for recycling or reuse.
This question shows which portions of your company’s waste are not disposed of but instead diverted for reuse or recycling as part of circular‑economy efforts.
To answer, add together the quantities of hazardous and non‑hazardous waste (in tonnes) that were demonstrably transferred to waste‑management companies for reuse or recycling during the reporting period. Round the result to two decimal places.
|
Note When reporting the annual total amount of waste diverted to recycling or reuse, you should consider the waste that is sorted and sent to recycling or reuse facilities (e.g., the amount collected in recycling containers or the sorting of waste into specific material categories and its delivery to waste‑treatment facilities), not the amount that is actually recycled or reused. |
Indicate the amount of hazardous waste intended for recycling or reuse.
This question clarifies the extent to which your company diverts hazardous substances—those posing risks to humans and the environment—from disposal and instead treats them through specialised processes for reuse.
To answer, review your waste documentation (e.g., manifests for hazardous waste) and sum all quantities that were demonstrably transferred to a licensed waste‑management company for recycling or reuse. Round the result to two decimal places.
|
Term |
Meaning |
|
Hazardous waste |
Waste that exhibits one or more of the hazardous properties listed in Annex III of Directive 2008/98/EC of the European Parliament and of the Council on waste. |
Example
An Austrian agricultural‑machinery repair business collects used lubricating oils and solvent‑based cleaning agents, which are classified as hazardous according to Annex III of Directive 2008/98/EC. Instead of thermally treating (incinerating) these wastes, the company commissions a specialised waste processor that refines used oil back into base oil. The company documents an annual amount of “800 kilograms of hazardous waste intended for recycling”.
Indicate the amount of NON‑hazardous waste intended for recycling or reuse.
This question aims to identify the share of your waste that is recovered as a valuable resource within the circular economy instead of ending up in landfills or incineration.
To answer, you need the weigh tickets or disposal confirmations from your waste‑management partners for materials such as paper, cardboard, metals, or plastics that were collected during the reporting period for reuse or recycling. Round the amount to two decimal places.
Example
An Austrian wholesale company for office supplies analysed its annual waste balance. It found that a total of 12 tonnes of wastepaper and cardboard, as well as 2 tonnes of clean PE films, were generated. Since these materials were delivered separately to a certified waste‑management company for recycling, the company states in its ESG report: “14 tonnes of non‑hazardous waste intended for recycling”.
Material flows
VSME B7
If your company operates in a sector with significant material flows, indicate the annual mass flow of relevant materials used.
This question aims to identify the physical quantities of raw materials and resources your company consumes, in order to assess resource efficiency and dependency on natural raw materials. It applies only to companies in the following NACE codes: NACE C – Manufacturing, NACE F – Construction, and NACE N82.92 – Packaging.
To answer, you need the weight data (e.g., in tonnes or kilograms) of your most relevant input materials, such as raw materials, auxiliary materials, or packaging used during the reporting period for production or service delivery.
|
Note Further details on this topic can be found in the VSME, section 108. |
Example
An Austrian metal processing company producing components for the automotive industry analysed its material flows for the previous financial year. The procurement department extracted the data from the ERP system: 450 tonnes of steel sheet, 15 tonnes of aluminium components, and 5 tonnes of packaging materials (wooden pallets and cardboard) were consumed. The company reports a total of 470 tonnes as its annual material mass flow. By documenting this transparently, the SME can precisely track in subsequent years whether measures such as optimising cutting patterns successfully reduced material usage per product sold — which is beneficial both ecologically and economically (reduced material costs).
Reduction measures - Waste
What measures does your company take to reduce waste?
This question is optional. It serves to illustrate how your company conserves resources and minimizes the environmental impact of waste in order to support the transition to a circular economy.
To answer this question, you will need information about your current processes for waste prevention, reuse of materials, or optimization of waste separation in accordance with the waste hierarchy.
Example
An Austrian manufacturer of plastic parts analyzed that large amounts of scrap are generated during production. As a measure, the company purchased a modern cutting machine that reduces waste by 15% (prevention) and feeds the remaining scraps directly back into its own melting process (recycling). In addition, the canteen switched to reusable systems and introduced digital document management to reduce paper consumption.

Damage caused by the effects of climate change
VSME C4
If your company has identified climate-related hazards and climate-related transition events that result in climate-related risks for the company on a gross basis, indicate these. Assign each selected risk a time frame (short-, medium- or long-term).
This question aims to clarify which concrete hazards your company has identified and within which time horizon these are expected to occur or become relevant.
To answer, you must list the risks that exist without taking into account any protective measures already implemented (gross perspective), and categorise them as short-term (usually up to 1 year), medium-term (2–5 years) or long-term (over 5 years).
|
Term |
Meaning |
|
Climate-related hazards |
These are climate-related physical risks arising from the impacts of climate change on the company. |
|
Climate-related transition events |
These may include increased obligations for emissions reporting, costs associated with transitioning to lower-emission technologies, rising raw material costs or increased stakeholder expectations. |
|
Climate-related risks |
Risks that may arise due to the exposure of the company’s assets or business activities to climate-related hazards. |
|
Gross perspective |
The gross perspective in sustainability reporting refers to the assessment of impacts, risks and opportunities before considering mitigating measures. |
Example
An Austrian transport company identified two major risks during its materiality analysis. First, the introduction of a significantly higher CO₂ levy on fossil fuels was classified as a short-term transition risk because it increases operating costs immediately. Second, the increase in severe hailstorms that could damage the vehicle fleet parked outdoors was classified as a medium-term physical risk. By assigning these different timeframes, the SME can prioritise whether to invest first in converting its fleet to electric trucks or in constructing protective roofing for vehicle parking areas.
Describe (1) the adverse impacts on your financial performance or business activities that may arise in the short-, medium- or long-term from the climate-related risks, and (2) whether you assess these risks as high, medium or low.
This question aims to make the potential financial consequences of climate change for your company tangible and to help determine the urgency of countermeasures.
To answer, you must assess how extreme weather events or new environmental regulations could affect your costs, revenues or asset values over different time horizons.
Example
An Austrian fruit-growing business conducted a risk analysis.
- Impacts: Short term, increasing late frosts lead to crop failures and higher insurance premiums. Medium term, investment costs for irrigation systems increase due to longer dry periods. Long term, the current variety may become unprofitable due to climate impacts, requiring an expensive restructuring of the entire orchard.
- Assessment: The company classifies the risk as high, as its existence depends directly on stable weather conditions and repeated crop failures would significantly reduce financial reserves.
Describe (1) how your company identified climate-related hazards and transition events, and (2) to what extent its assets, activities and value chain are affected by these risks and transition events.
This question aims to clarify the process your company uses to identify risks related to climate change (e.g. flooding) or the transition to a low‑carbon economy (e.g. new regulations) and to what degree your operations or finances are affected.
To answer, you need a simple risk analysis of your sites, an assessment of your key suppliers, and an evaluation of whether your products or services may be pressured by future environmental requirements.
Example
An Austrian metal goods manufacturer conducted a site assessment workshop and found that its production hall is located near a stream that increasingly overflows during heavy rainfall (physical risk). It also identified that rising CO₂ prices significantly increase raw material costs in the value chain (transition risk). In its report, the company explains that it identified these hazards using a site checklist and regular market monitoring. It now classifies 20% of its assets as at risk of flooding and therefore plans targeted investments in flood barriers and supplier diversification.
Measures for identified risks
VSME C4
Indicate whether your company has implemented climate‑change adaptation measures in response to identified climate‑related risks and transition events.
This question aims to show how proactively your company responds to the effects of climate change in order to safeguard long‑term business continuity.
To answer, you must assess whether you have implemented concrete strategies or structural measures that protect your sites or supply chains from extreme weather events (physical risks) or regulatory changes (transition risks).
Example
An Austrian logistics company with a large warehouse site found that increasing heatwaves threatened both employee working conditions and its cooling chains.
As an adaptation measure, the company installed a large photovoltaic system to supply self‑generated electricity for cooling and invested in improved roof insulation as well as a natural shading system. Through these measures, the SME reduces the risk of operational disruptions caused by heatwaves.
Since the company has taken climate‑change adaptation measures in response to identified climate‑related risks and transition events, it answers this question with “yes”.
Other
Other environmental information
In addition to the requirements of this questionnaire, do you also collect company‑specific or sector‑specific sustainability information in the area of Environment in order to enable more comprehensive and credible reporting?
If yes, you may use the free‑text field to provide these details.
This question is optional and may be answered with key figures and/or descriptive information. It can be marked with the option “Do not answer this question”, or answered with a short statement. The information provided should help create relevant, accurate, comparable, understandable and verifiable disclosures. This allows individual characteristics and values of the company to be highlighted.
Providing information in this section may help protect the company from accusations of greenwashing. Transparent disclosure of sustainability data may also provide a competitive advantage.
|
Term |
Meaning |
|
Company‑specific |
Information on sustainability aspects that are specific to the company. |
|
Sector‑specific |
Information on sustainability aspects that are common within the company’s sector. |
|
Note A detailed list with examples of sustainability aspects can be found in Annex A of this handbook. |
Example
An Austrian textile processing company has identified not only CO₂ emissions but also its water consumption and wastewater quality as sector‑specific topics. Since dyeing processes are highly water‑intensive, the company additionally records the amount of recycled process water and the use of biodegradable dyes. By providing these additional data in the free‑text field, the SME demonstrates that it understands and proactively manages the essential environmental risks of its sector. This significantly increases credibility with critical stakeholders and large customers.